First part: Why “doi moi” [renovation] policy was promulgated and how it implemented?
Vietnamese Economy Period 1976-1986
Vietnam followed centrally planned economy model (CPE)
The South turned into CPE based on:
- State-owned enterprises in industry
- Cooperatives in agriculture and fishery
State monopolized in foreign trade both of import and export.
Specifics of Centrally Planned Economy
1. No private business only SOEs
2. No maximization profit
3. No competition
4. No advertisement and marketing
5. No unemployment (theory)
6. No inflation
7. No commercial banks
8. No bankruptcy
9. Fixed interest rate
10 Fixed retailed price of goods and services
Vietnamese Economy Period 1976-1986
Social and economic crisis occurred:
- restriction domestic trade
- shortage in basic goods
- production sharply decreased
- isolated with outside world
- people fled country
- Vietnamese troops stuck in Cambodia until 1989
First attempt to change
- First attempt: Decree 100 in 1981
- Empower to State Owned Enterprises When to produce How to produce and What to produce and payment based on productivity
- To allocate planned output to farmers and let them free to do farm works
- Recognized households are independent unit production in agriculture (1988 by decree 10)
Second attempt to change
- Second attempt in 1985:
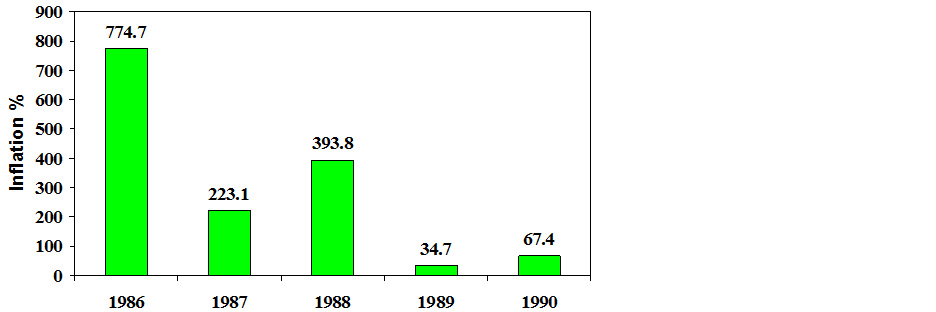
- Reformation policy in pricing-in wages-in monetary: no longer distributing goods with lower price in state network, increasing wages that allow people to purchase goods in free market. Supply more money to the economy resulted in superhigh inflation 775% in 1986.
Why changed?
Outside factors
1. In USSR Gorbachev introduced “perestroika” in 1985. Stop aid to Vietnam
2. China stopped aid since 1979 and becomes enemy
3. 1976-1986 The US embargo resulted in isolating from the world
Inside factors
1. 1976-1986: deeply socio-economical crisis in the country (economy sharply declined & million people fled country)
2. Changing mind at high leadership
Key point to successfully change
- Normalization relation with the US
- 3 February 1994 President Bill Clinton lift embargo to Vietnam
- 1995 diplomatic relation fully set up between Washington D.C. and Ha Noi
- Lately exchanged high leadership visits
- Finally promoted to Strategic Comprehensive Partnership between two countries (2023)
Vietnam-USA: from enemy to strategic comprehensive partnership
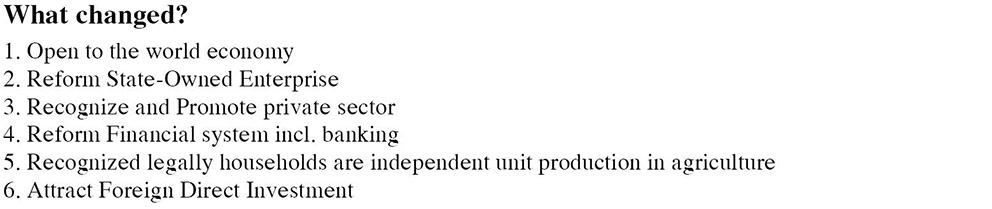
- 1999: PM Phan Van Khai met with Bill Clinton in Auckland, New Zealand (within APEC meeting).
- 2005: PM Phan Van Khai visited USA
- 2007: President Nguyen Minh Triet visited USA
- 2014: President Truong Tan Sang visited USA
- 2015: General Secretary CPV Nguyen Phu Trong visited USA
▲ Prime Minister Phan Van Khai met with Bill Clinton in Auckland, 1999
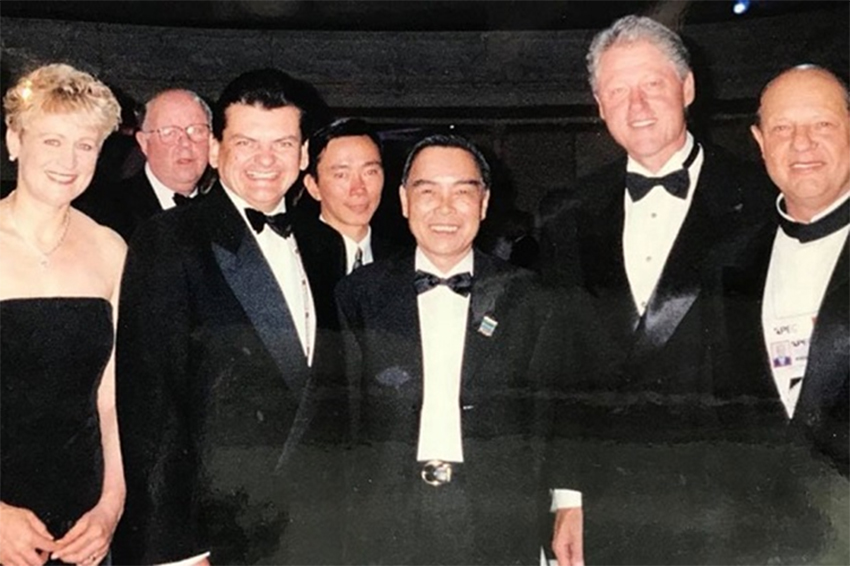
▲ Clinton in Hanoi 2000
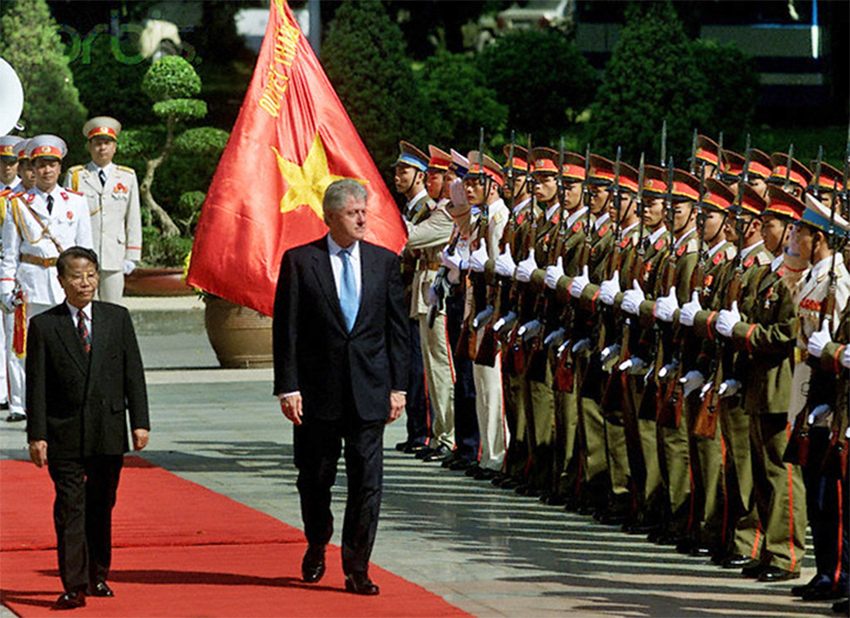
▲ Bush in Hanoi 2006

▲ Obama in Hanoi 2016
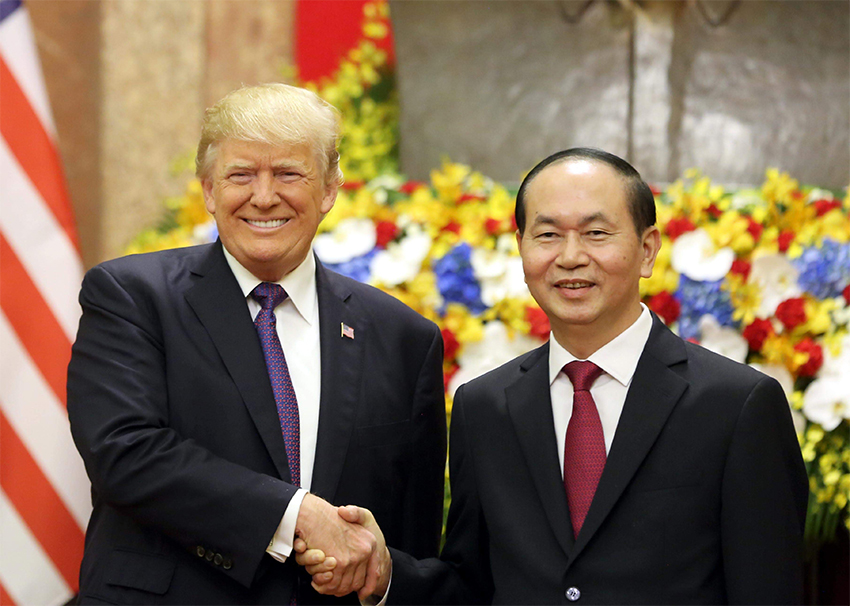
▲ Trump in Hanoi 2017
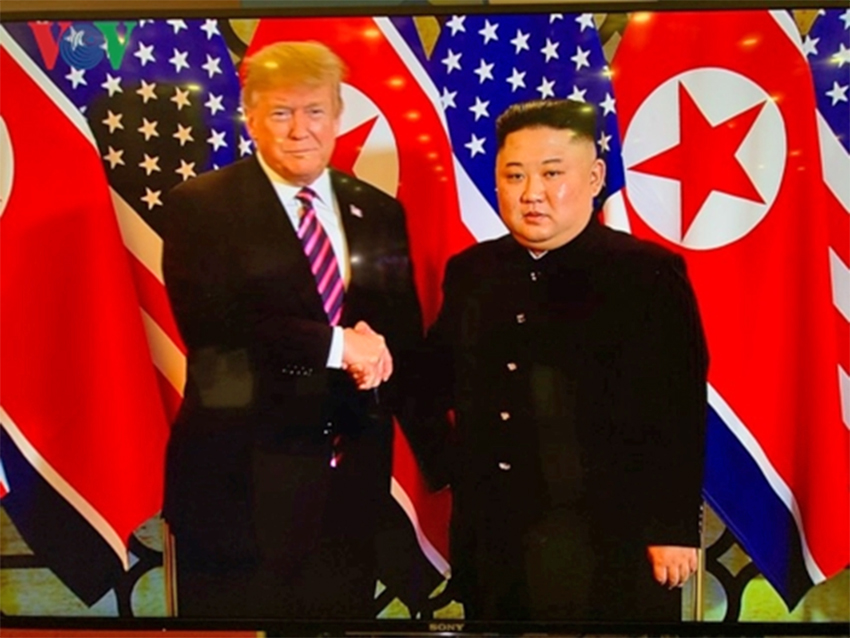
▲ Trump met Kim Jong Un in Hanoi 2019
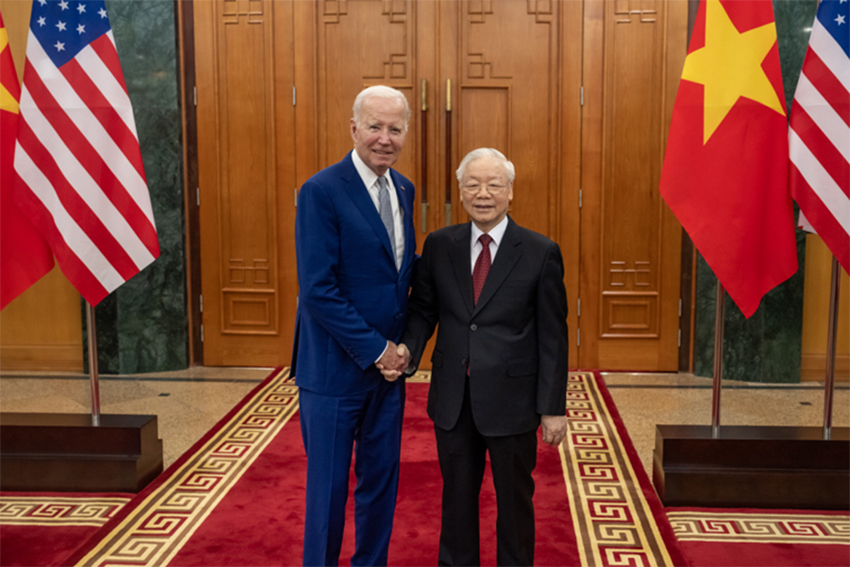
▲ Biden in Hanoi 2023
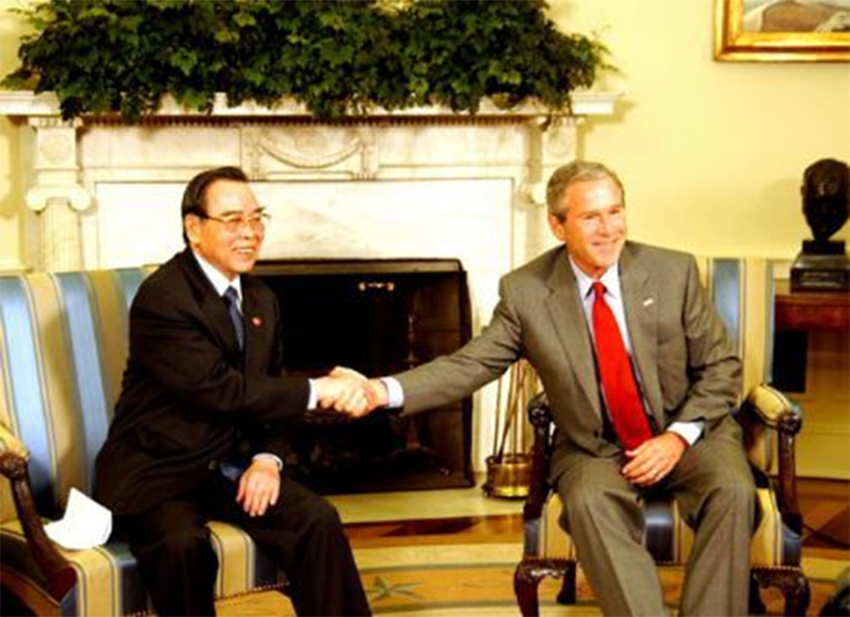
▲ Prime Minister Phan Van Khai visited USA 2005
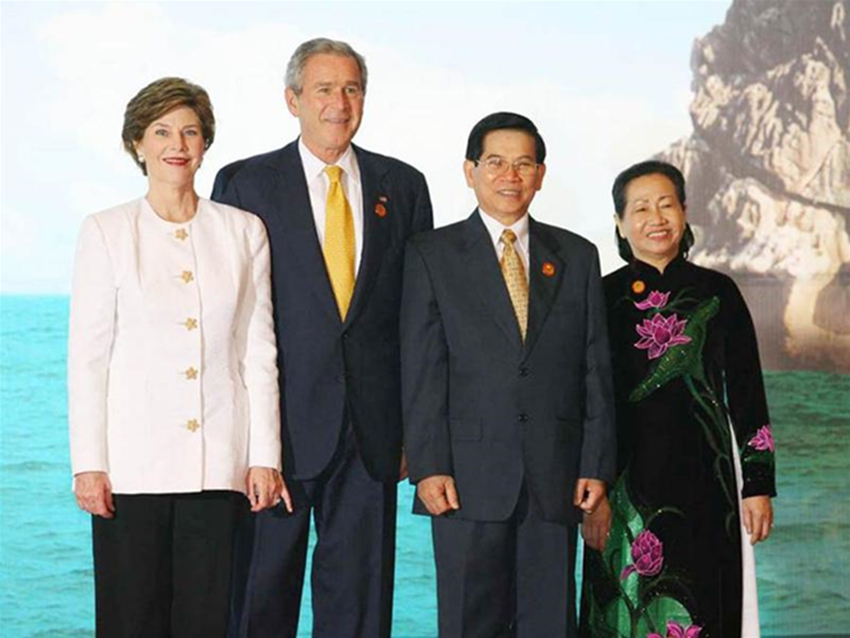
▲ President Nguyen Minh Triet in Washington D.C. 2007
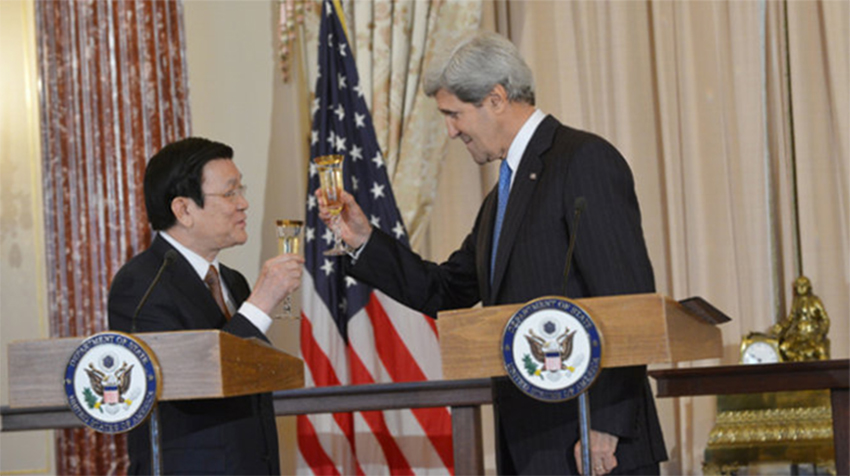
▲ President Truong Tan Sang in Washington D.C. 2014
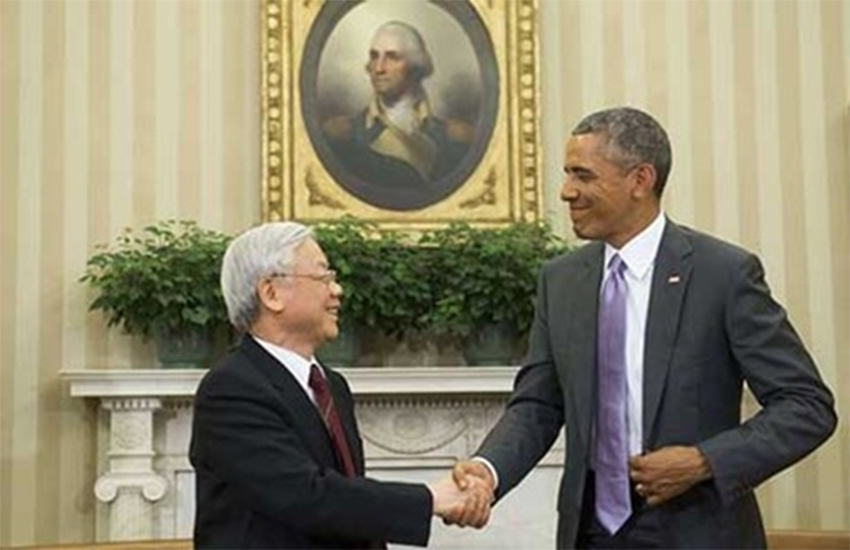
▲ General Secretary Nguyen Phu Trong in White House 2015
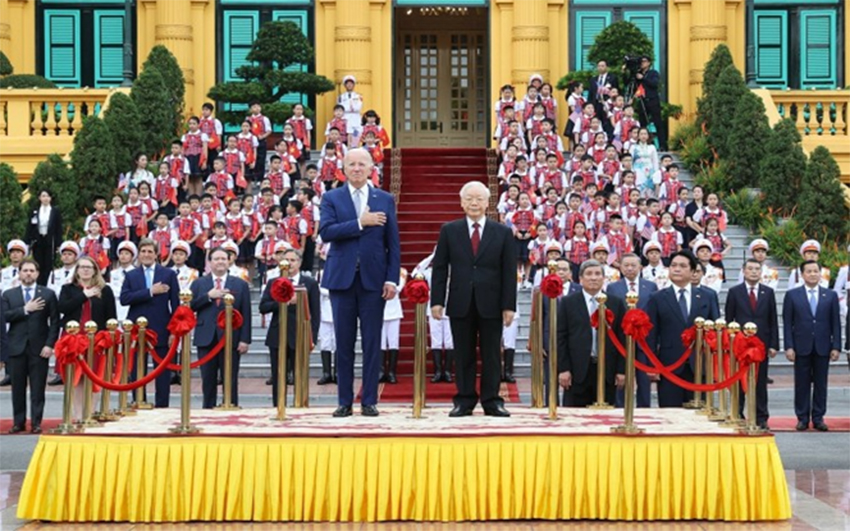
10 September 2023 in Hanoi
President Biden announced Strategic Comprehensive Partnership with Vietnam
1. Integration into the World
- 1993: IMF, WB, ADB
- 1995: US and ASEAN
- 1996: ASEM
- 1998: APEC
- 2000: US-VN BTA
- 2007: 150th member WTO
- 2010: Join TPP negotiation
- 2019: CPTPP effective to VN
- 2020: EVFTA (EU-Vietnam Free Trade Agreement) effective to VN
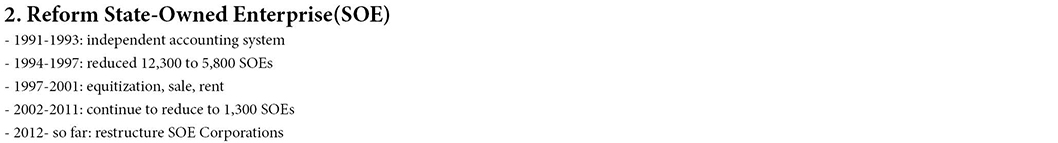
3. Private Sector Development
- 1990: Company Law and Law on Private Enterprise 35,000 private enterprise established during 1991-98
- 2000: Enterprise Law 80,000 private enterprise established during 2001-04 (Billion USD9.5)
- 1 July 2006: New Law on Enterprise
New Law on Investment
New Law on Trade
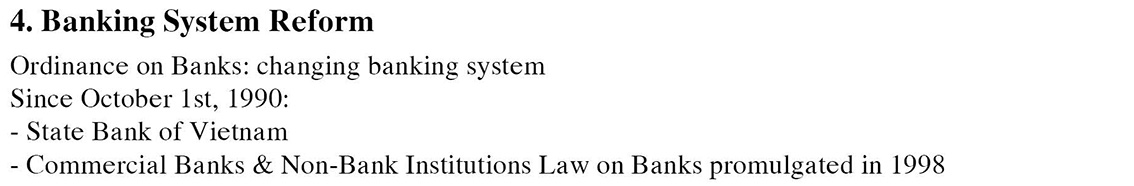
4.1 Non-bank Institutions
- People credit funds: financial cooperatives
- Leasing companies:
- Financial companies: rubber,textile,aquatic…
- Insurance companies: Bao Viet, Bao Minh, Prudential, AIA, Manulife,Life Ace…
5. Attract FDI 2019-2924 (realized capital, billion USD)
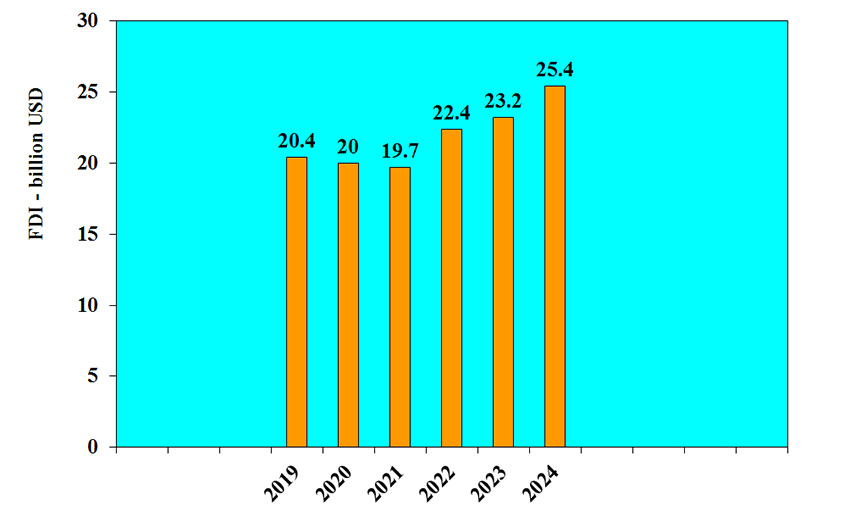
5.1 Structure realized FDI (2024)
- Proccessing & production 81.4% ($20.62billion)
- Real estate: 7.2%, ($1.84billion)
- Electricity, gas, water, air conditioners : 4.2%, ($1.07billion)
- Others: 7.2%, ($1.77billion)
FDI ranking new registered capital ($billion), 2024
1. Singapore: $6,26
2. Korea : $2.89
3. China : $2.84
4. Hongkong: $2.17
Ranking provinces by attract FDI ($billion new registered capital), 11/2024
1. Bac Ninh: $5.04
2. Quảng Ninh: $2.29
3. Ho Chi Minh City: $2.28
4. Hai Phong: $2.15
5. Ha Noi: $2.07
6. Binh Duong: $1.82
7. Ba Ria-Vung Tau: $1.71
8. Dong Nai: $1,67
9 Nghe An : $1.57
10. Bac Giang: $1.17
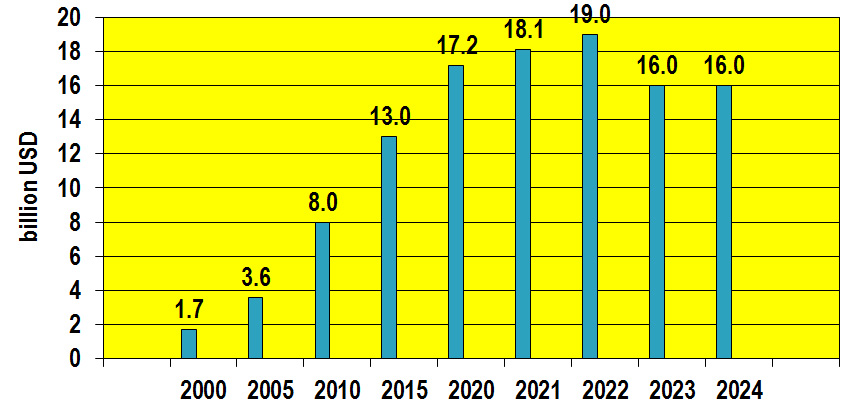
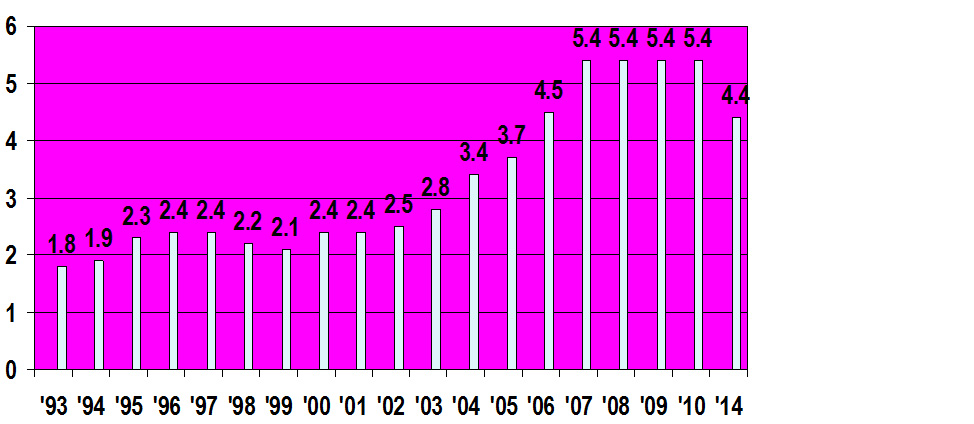
6. Overseas Vietnamese Capital to Vietnam 2000-2024
7. Attract foreign tourist 2000-2024
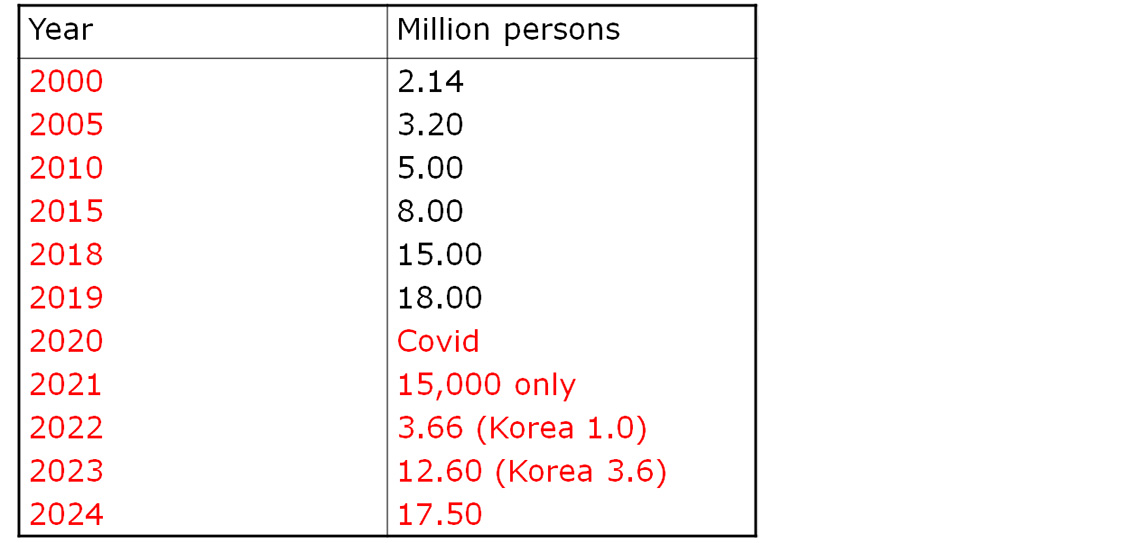
7.1 Attract Tourist 2000-2024
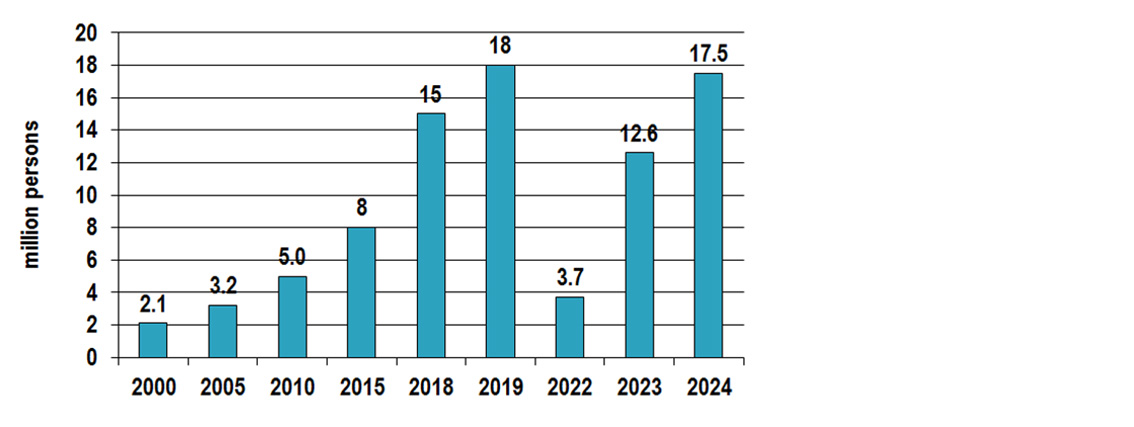
Ranking countries by tourists come to Vietnam (million persons), 2024
1. Asia: 79.6%
2. Europe: 11.3%
3. America: 5.7% of which
4. Korea: 4.5
5. China: 3.7
6. Taiwan: 1.29
7. USA: 0.78
8. Japan: 0.71
9. India: 0.50
10. Malaysia: 0.25
11. Australia: 0.49
12. Cambodia: 0.47
13.Thailand: 0.42
8. ODA committed - USDbillion
8.1. No longer ODA for Vietnam since 2018
In the period 1993-2014:
- ODA committed nearly USD90 billion of which 10-12% non-refundable, 80% privilege loan, 8-10% mixed.
- ODA signed USD14 billion average annually USD3.5 billion
8.2. ODA providers
- Multilateral providers: WB, IMF, ADB, UN Demography Fund, UN Industrial Development Program, UNICEF, UNDP, UNESCO, ILO, FAO, WHO
- Bilateral providers: Japan, Belgium, Denmark, Korea, Sweden…
Second part: Progress has been made since “doi moi” policy promulgated
Socialist Republic of Vietnam
Progress have been made
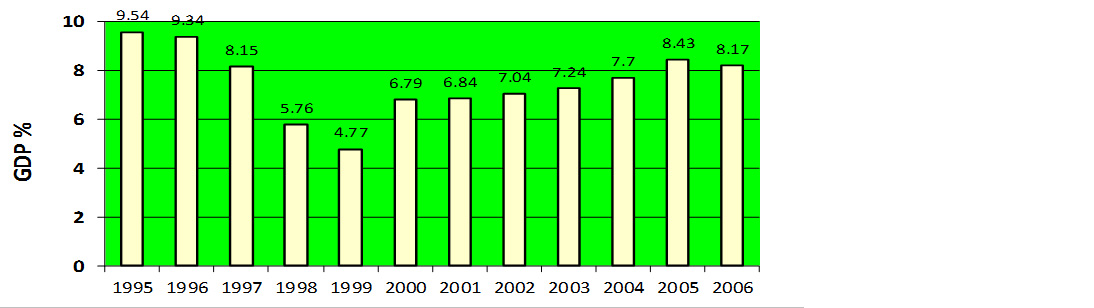
GDP Growth (%) 1995 –2006
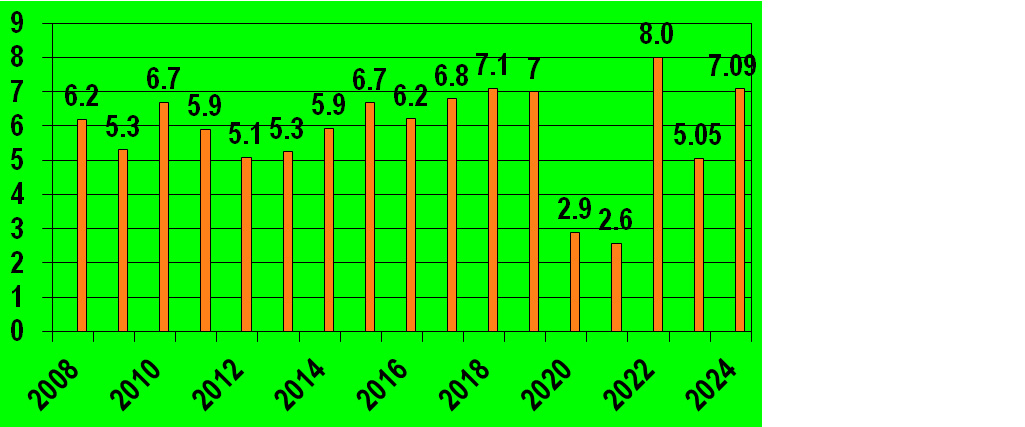
GDP Growth Rate 2007-2024 (%)
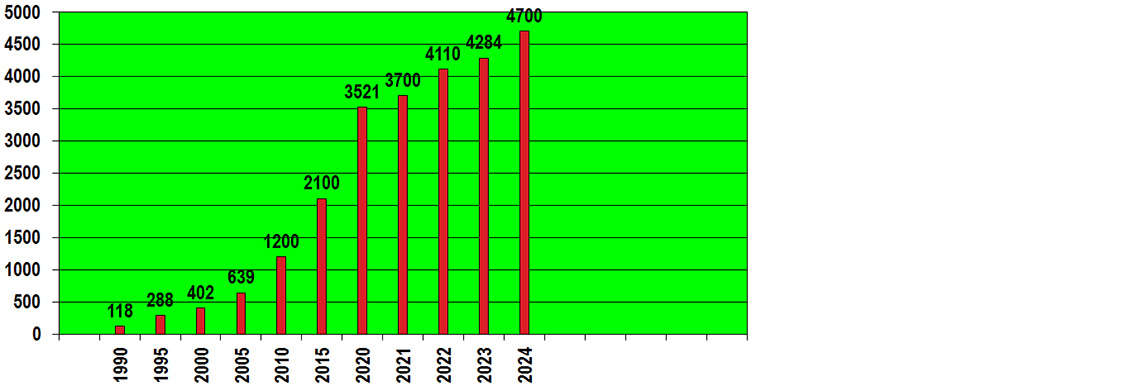
GDP size in USD billion 2005-2024
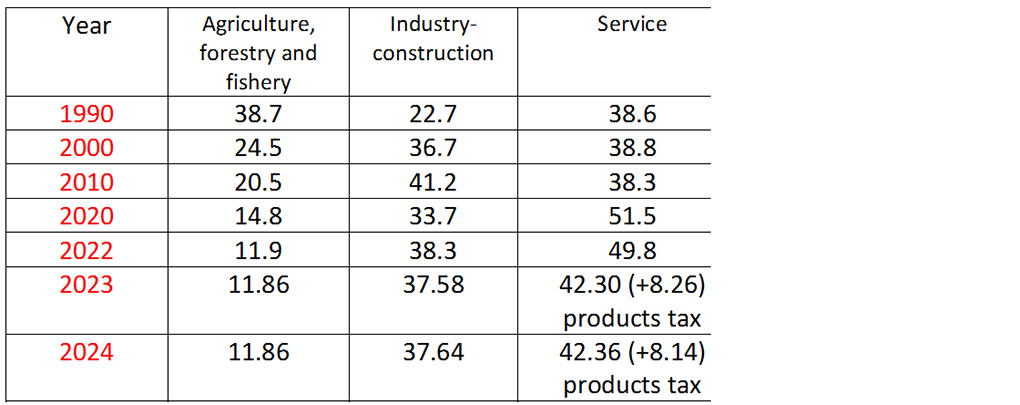
Structure of GDP - % 1990-2024
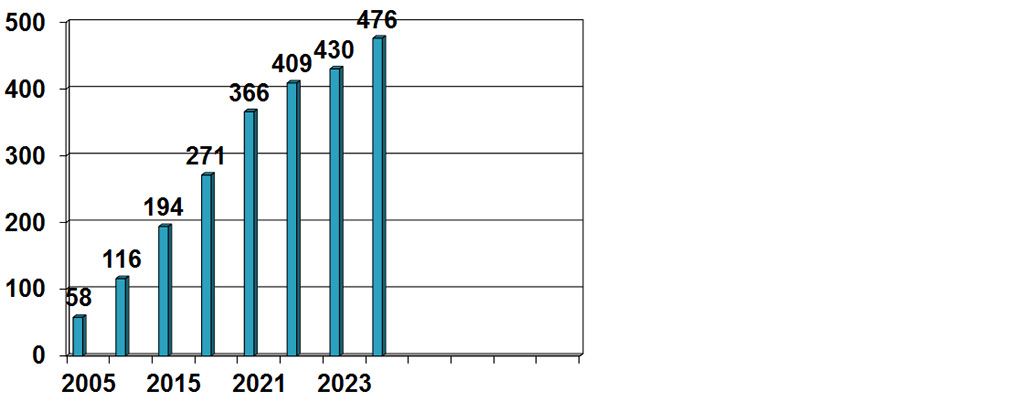
GDP per capita (USD) every five year 1990-2024
Inflation Rate 1986-1990
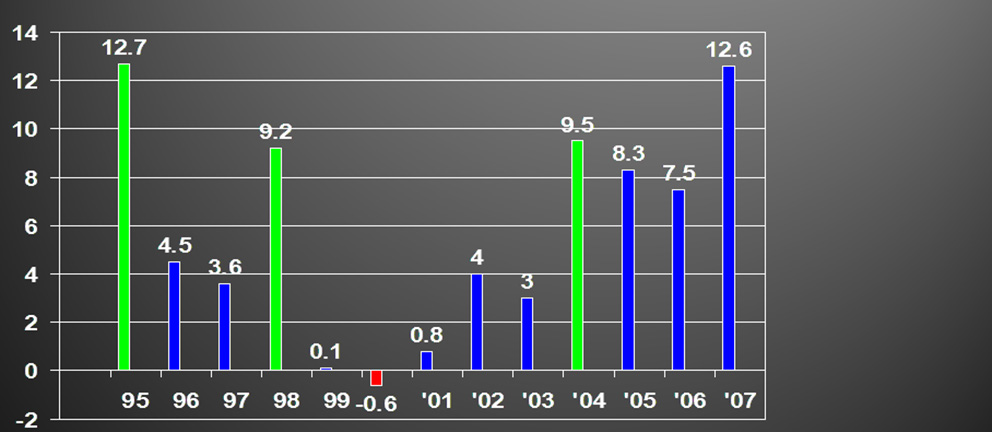
Inflation Rate 1995-2007
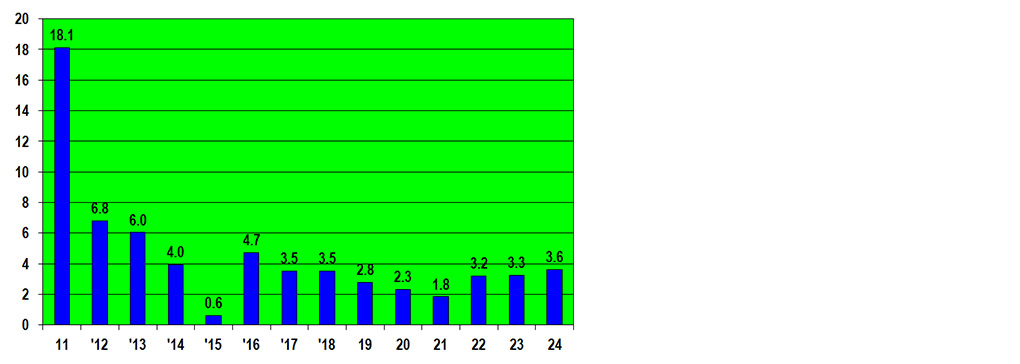
Inflation Rate (2011-2024)
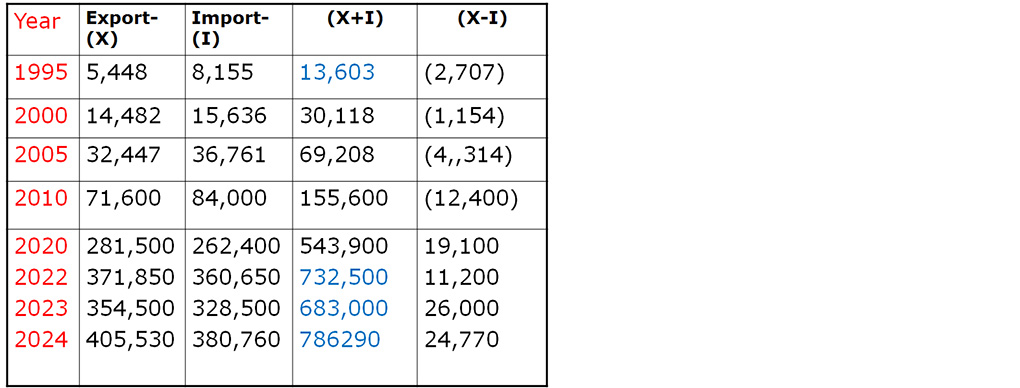
Import Export Turnover 1995-2024 (million USD)
Vietnam’s Six biggest trading partners in 2024
by the Import & Export Value (X+I) (USD Billion)
1. China: 204.9
2. USA: 134.6
3. South Korea: 81.8
4. ASEAN: 83.9
5. EU: 68.8
6. Japan: 46.0
8 commodities exported value over USD10 billion, 2024
1. Electronic, computers and accessories: 72.6
2. Smart Phones and accessories: 53.9
3. Machinery, equipment: 52.3
4. Textile & garment: 37.0
5. Footwear: 22.9
6. Transport vehicles: 15.1
7. Wood & furniture: 16.3
8. Aquatic products: 10.0
6 commodities imported value over USD10 billion, 2024
1. Electronic, computers and accessories: 107.1
2. Mechinary, equipment and spare parts: 48.9
3. Garment material: 14.9
4. Steel: 12.6
5. Plastics: 11.8
6. Smart phones and accesaries: 10.4
Vietnam-China Trade Balance (USD Billion, 2009-2024)
|
Year
|
Exported to China (X)
|
Imported from China (I)
|
(X+I)
|
(X-I)
|
|
2009
|
5.0
|
16.5
|
21.5
|
(11.5)
|
|
2014
|
14.9
|
43.8
|
58.7
|
(28.9)
|
|
2015
|
17.0
|
49.0
|
66.0
|
(32.0)
|
|
2018
2019
2020
2022
2023
2024
|
41.3
41.4
48.9
57.7
61.2
61.2
|
65.4
75.5
84.2
117.9
110.6
144.0
|
106.7
116.9
133.1
175.6
171.8
205.2
|
(24.1)
(34.1)
(35.3)
(60.2)
(49.4)
(82.8)
|
Vietnam – USA Trade Balance (USD Billion, 2006-2024)
|
Year
|
VN exported
to USA (X)
|
VN imported
from USA (I)
|
(X+I)
|
Trade
Balance (X-I)
|
|
2006
|
8.6
|
1.1
|
9.7
|
7.5
|
|
2009
|
12.3
|
3.1
|
15.4
|
9.2
|
|
2010
|
14.2
|
3.8
|
18.0
|
13.2
|
|
2020
2022
2023
2024
|
61.4
109.4
96.78
117.6
|
14.4
14.5
13.78
13.0
|
75.8
123.9
110.56
130.6
|
47.0
94.9
83.0
104.6
|
Major other trading partners: EU (USD billion, 2014-2024)
|
Year
|
Exported to
(X)
|
Imported
from (I)
|
(X+I)
|
(X-I)
|
|
2014 2017
2020
2022
2023
2024
|
22.1
38.3
43.7
46.7
44.1
52.1
|
6.2
12.0
18.5
15.3
15.0
16.7
|
28.3
50.3
62.2
62.0
59.1
68.8
|
15.9
26.3
25.2
31.4
29.1
35.4
|
Major other trading partners: Japan (USD billion, 2015-2024)
|
Year
|
Exported
to (X)
|
Imported
from (I)
|
(X+I)
|
(X-I)
|
|
2015 2019 2020
2022
2023
2024
|
14.1
20.4
19.3
24.2
23.5
24.6
|
14.4
19.6
20.3
23.4
21.8
21.4
|
28.5
40.0
39.6
47.6
45.3
46.0
|
(0.3)
0.8
(1.0)
0.9
1.7
3.2
|
Major other trading partners: South Korea (USD billion, 2015-2024)
|
Year
|
Exported
to (X)
|
Imported
from (I)
|
(X+I)
|
(X-I)
|
|
2015
2017
2020
2022
2023
2024
|
9.8
15.0
19.1
24.3
23.5
25.5
|
27.8
46.8
46.9
62.1
52.6
56.2
|
37.6
61.8
66.0
86.4
76.1
81.7
|
(18.0)
(31.8)
(27.8)
(37.8)
(29.1)
(30.7)
|
Major other trading partners: ASEAN (USD billion, 2017-2024)
|
Year
|
Exported
to (X)
|
Imported
from (I)
|
(X+I)
|
(X-I)
|
|
2017 2019 2020 2022 2023
2024
|
21.7
25.2
23.1
33.9
32.7
37.0
|
28.0
32.1
30.5
47.3
41.0
46.9
|
49.7
57.3
53.6
81.2
73.7
83.9
|
(7.7)
(6.9)
(7.4)
(13.4)
(8.3)
(9.9)
|
Types of Business Structure
1. State-owned company
2. Private company
3. Joint-stock company
4. Joint-venture company
5. Foreign company
6. Millions small traders
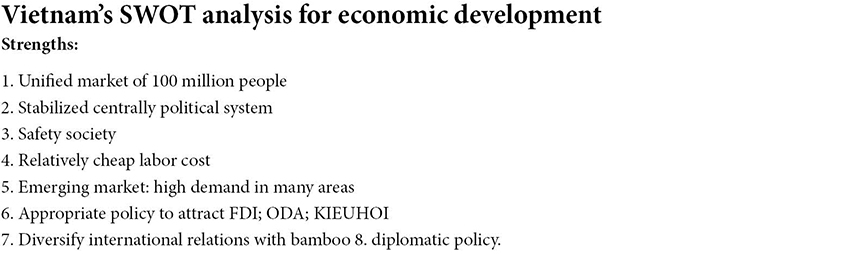
Vietnam’s SWOT analysis for economic development
Opportunities:
1. Peaceful Asian Pacific region
2. China has been developing
3. Digitalization and AI rapidly have been developing
4. Globally neo-liberalism of human and capital
5. ASEAN is closely in economic cooperation
6. US policy has focused on Indian Pacific region
7. US China Trade War
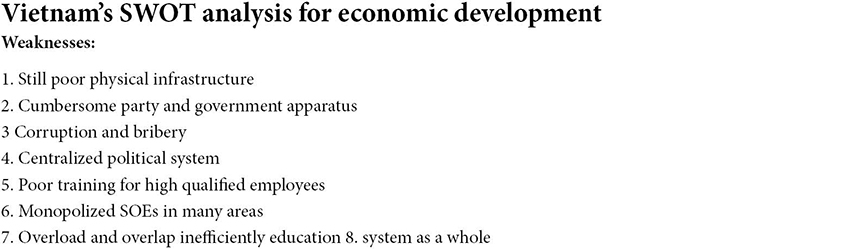
Vietnam’s SWOT analysis for economic development
Threats:
1. China’s trade competition
2. China’s ambitious in the Eastern sea
3. War in Ukraine has affected global economy
4. Israel Hamas war
5. Nuclear crisis with North Korea and Iran
6. Taiwan problems with China and the US
7. Increased investment in military in the world
References
1. Chung Viet, (2024), Năm 2023, tổng kim ngạch xuất nhập khẩu Việt Nam đạt hơn 681 tỷ USD, Quân đội nhân dân online. www.qdnd.vn
2. Mai Huong, (2024), 2023: Vietnam’s GDP increases by 5.05%, reaching 430 billion USD, www.vietnam.vn
3. Lê Vân, (2024), Năm 2023, có 12,6 triệu lượt khách du lịch quốc tế đến Việt Nam, Tạp chí Kinh Tế và Dự Báo online. www.kinhtevadubao.vn
4. Hai Yen, (2024), Tổng kim ngạch thương mại Việt Nam-Trung Quốcnawm 2023 đạt 171 tỷ USD, Đàu tư chứng khoán online. www.m.tinnhanhchungkhoan.vn
5. Thông tin điện tử Tổng cục Thống kê (2024), Tình hình thu hút đầu tư nước ngoài năm 2023, www.gso.gov.vn.
6. VnEconomy, (2023), Hợp tác Việt Nam – Hàn Quốc bước vào thời kỳ phát triển mới.
7. Tổng Cục Thống Kê, (2025), Bưc tranh xuất, nhập khẩu hàng hóa của Việt Nam năm 8. 2024-Phục hồi, phát triển và những kỹ lục mới.. Gso.gov.vn